|
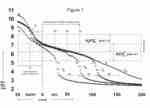
Figure 1
Titration curves with 150 pH measurements per curve of (a) 5 mM di-hydrogenphosphate (triangles), (b) 10 mM hydrogencarbonate (crosses), (c) 10 mM hydrogencarbonate plus 5 mM di-hydrogenphosphate (skewed crosses) and (d) 10 M (0.1%) amyloglucosidase, 340 M (0.5%) lysozyme, 10 mM hydrogencarbonate and 5 mM di-hydrogenphosphate (diamonds).
|
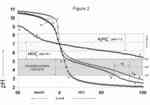
Figure 2
Titration curves with 86 pH measurements per curve of (e) 340 M (0.5%) lysozyme in water (open squares), (f) 10 M (0.1%) amyloglucosidase in water (skewed crosses), (g) 10 M (0.1%) amyloglucosidase plus 340 M (0.5%) lysozyme in water (crosses) and (d) 10 M (0.1%) amyloglucosidase, 340 M (0.5%) lysozyme, 10 mM hydrogencarbonate and 5 mM di-hydrogenphosphate (diamonds).
|

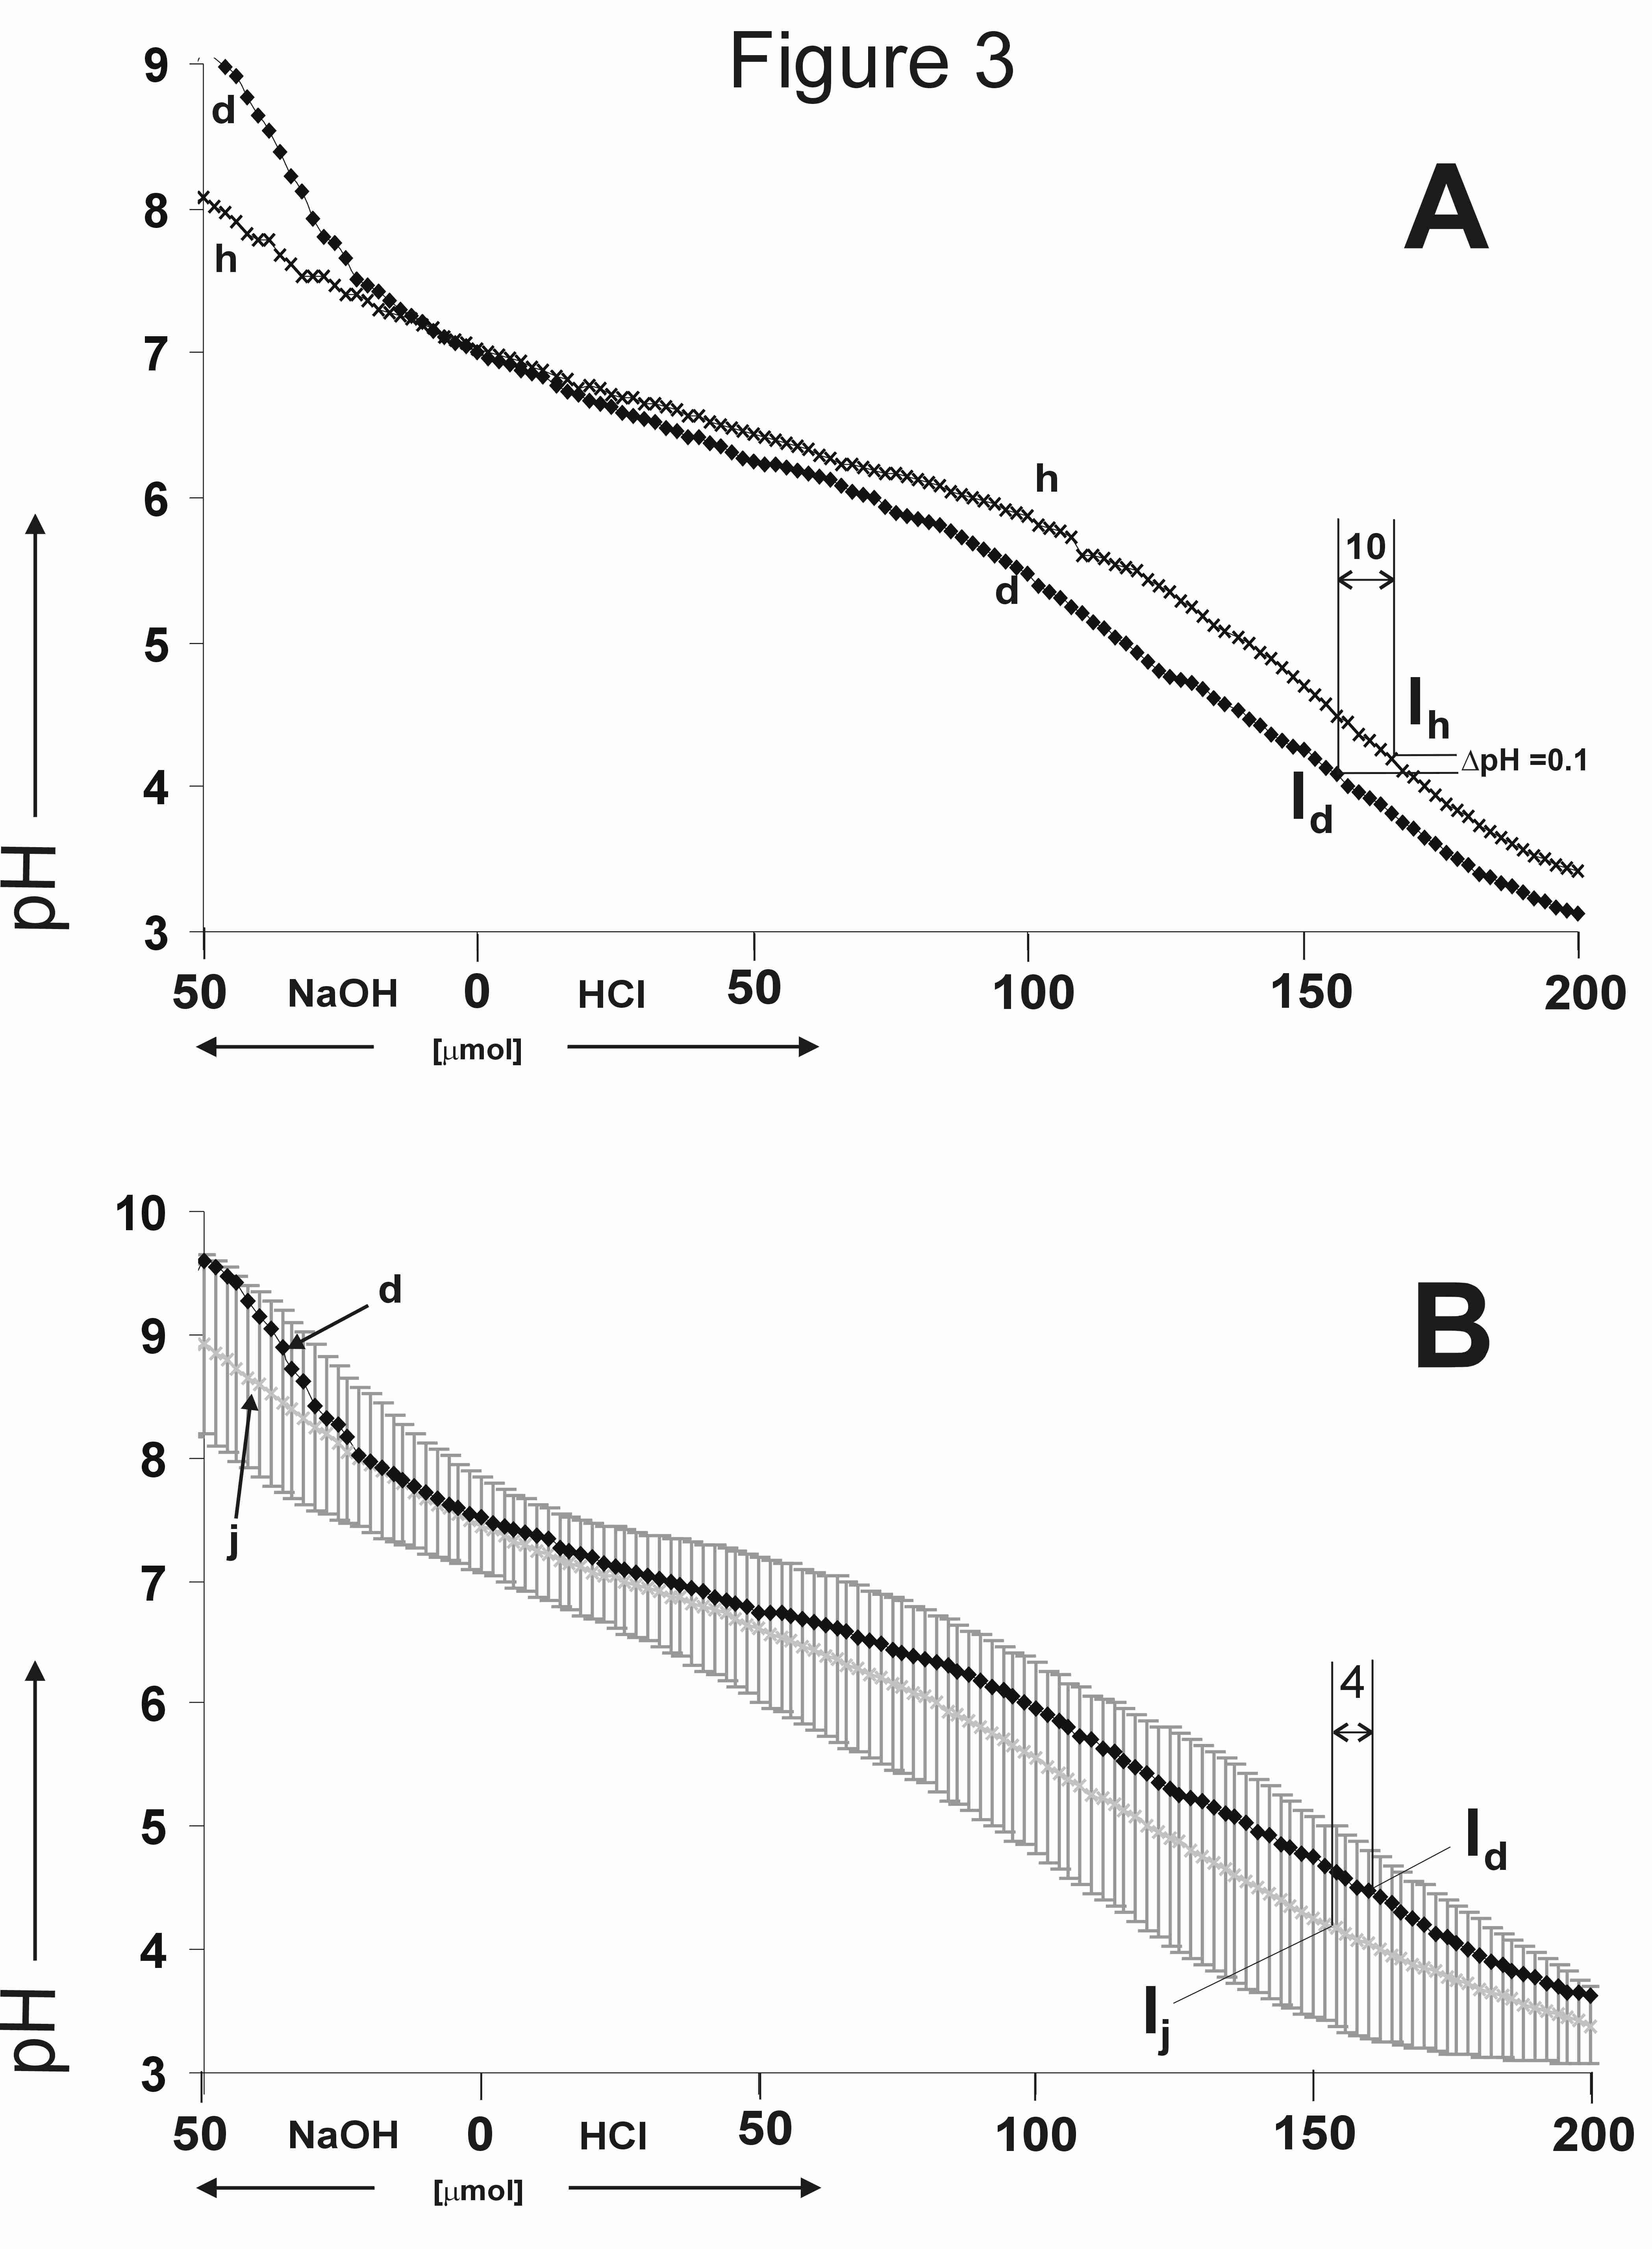
Figure 3
Panel A: Titration curves with 150 pH measurements per curve of (h) human saliva (skewed crosses), and (d) 10 M (0.1%) amyloglucosidase, 340 M (0.5%) lysozyme, 10 mM hydrogencarbonate and 5 mM di-hydrogenphosphate (diamonds Panel B: Titration curve with 150 pH measurements per curve of (d) 10 M (0.1%) amyloglucosidase, 340 M (0.5%) lysozyme, 10 mM hydrogencarbonate and 5 mM di-hydrogenphosphate (diamonds) and (j) titration curve with 150 averaged pH measurements (5 per pH measurement point) of 5 male subjects (skewed crosses) with standard deviations indicated by grey bars.
|